Debug in IntelliJ
In this guide, we’ll be setting up IntelliJ CLion for debugging the Core Process of your Tauri app.
Prerequisites
You need to install the IntelliJ Rust Plugin so that Rust features are enabled.
Top-level Cargo Workspace
By default, Tauri places the Rust project in a subdirectory called src-tauri. CLion may not recognize Cargo projects that are not at the top-level, in which case you should be able to attach it by using Cargo -> Attach Cargo project. If this option does not work, you will need to create a top-level Workspace that just points to the main Cargo.toml file:
[workspace]members = ["src-tauri"]Before you proceed, make sure that your project is fully loaded. If the indexing is finished and the Cargo tool window shows all the modules and targets of the workspace, you’re good to go.
Run/Debug Configuration
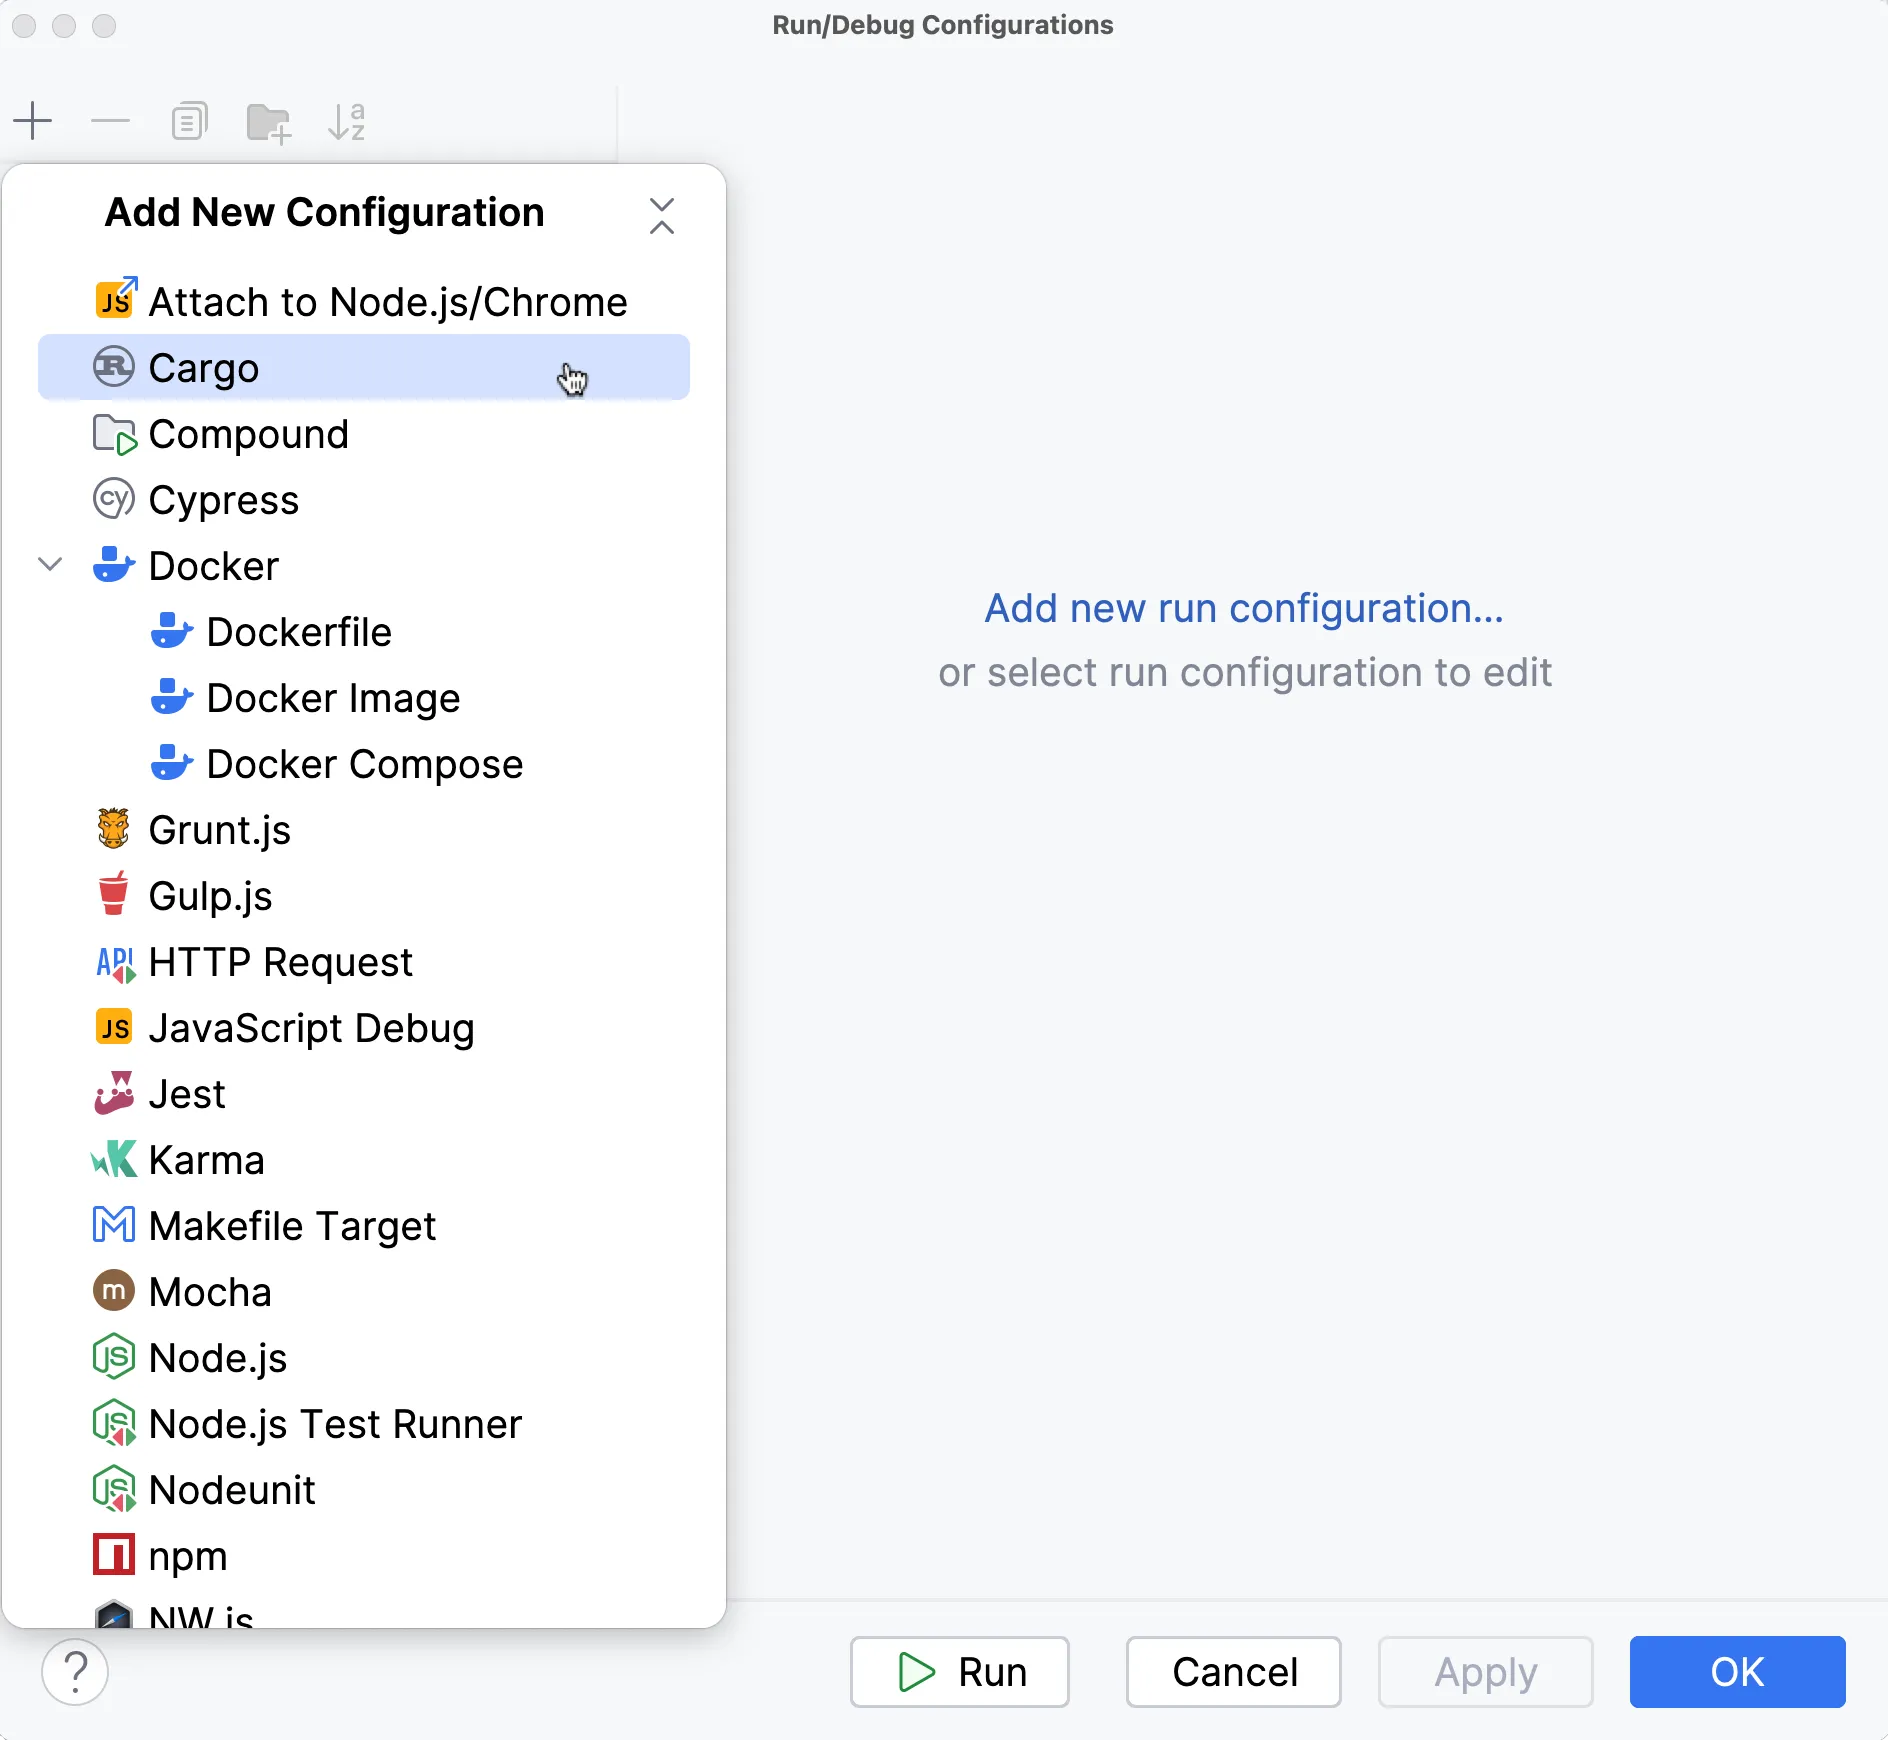
We will set up a Run/Debug configuration that we can use to launch our Tauri app in debugging mode. To create a configuration, go to Edit Configurations, click +, and then select Cargo Command.
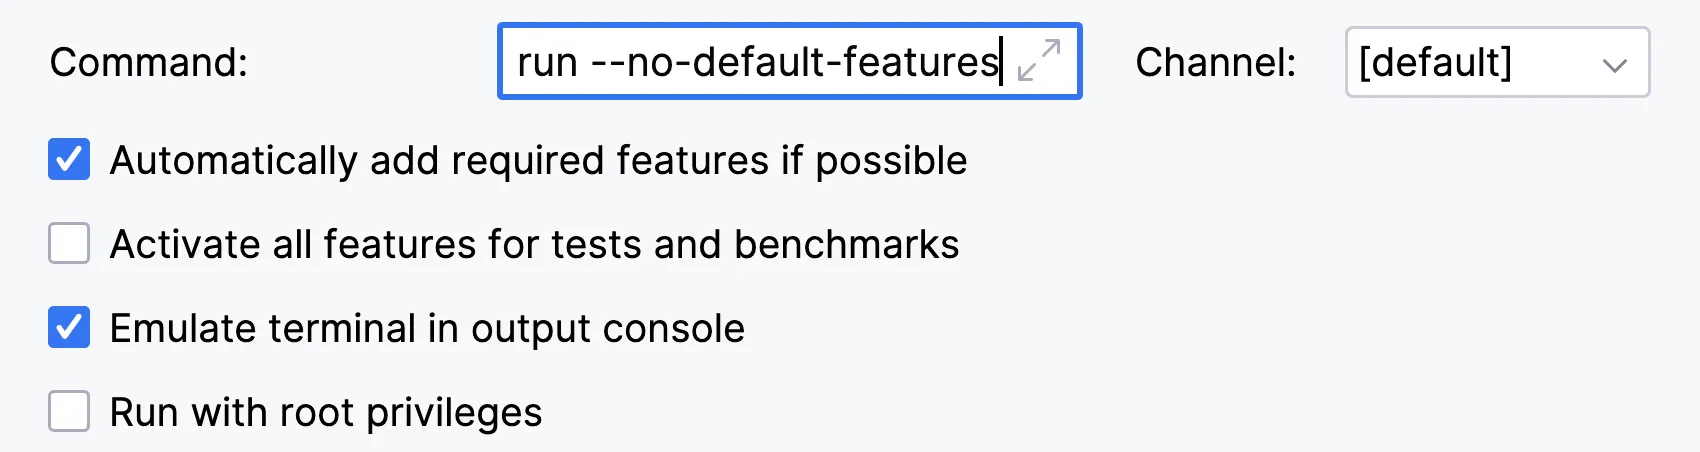
With that created we need to configure CLion so it instructs Cargo to build our app without any default features. This will tell Tauri to use your development server instead of reading assets from disk. Normally this flag is passed by the Tauri CLI, but since we’re completely sidestepping that here, we need to pass the flag manually.
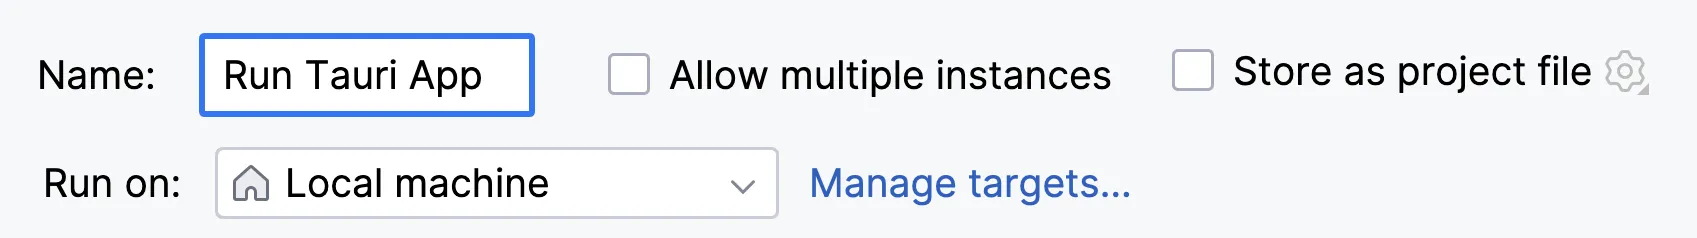
Now we can optionally rename the Run/Debug Configuration to something more memorable, in this example we called it “Run Tauri App”, but you can name it whatever you want.
Launch the Development Server
The above configuration will use Cargo directly to build the Rust application and attach the debugger to it. This means we completely sidestep the Tauri CLI, so features like the beforeDevCommand and beforeBuildCommand will not be executed. We need to take care of that by opening a new Terminal and starting running the development server manually:
pnpm vite devNote that CLion currently has no support for background tasks in Run/Debug configurations like VS Code has, so for now you need to manually run the development server.
Launch a Debugging Session
With the development server running and the Run/Debug Configuration selected in the Switcher, you can now start a new debugging session by clicking Debug. CLion will automatically recognize breakpoints placed in any Rust file in your project.
© 2024 Tauri Contributors. CC-BY / MIT